 |
|||||||||
 |
|||||||||
June 16, 2023 – TheNewswire – One of the key recommendations experienced traders love to give beginners is to use a moderate number of indicators. As beginners learn about Forex and other financial markets they find out many exciting new indicators and are eager to use as many of them as possible. But the number of indicators is not the defining factor in achieving profitability and an excess number of lines and numbers on the price chart can play an opposite role and make it difficult to read the price and make wise decisions. Let’s dive in and explain a few indicators that can help traders get the most out of price charts without cluttering their screens.

Click Image To View Full Size
Which indicators are easier to read for beginners?
The two trading platforms that are known to be home to countless indicators are MetaTrader 4 (MT4) and MetaTrader 5 (MT5). MT5 is a slightly upgraded version of MT4 and offers more features and a modern design. Among the best MT5 trading indicators to apply on your chart are Zig Zag, Alligator, and Money Flow Index (MFI). These indicators track the market and show important levels and help traders analyze markets better. Zig Zag allows you to see trend lines and makes it easier to identify trends and breakouts that can be very helpful for beginners. Alligator is following the price and shows its dynamics and how much it’s trending. MFI uses volume and price action to determine potential reversal points on the chart. There are so many indicators in the trading world it is extremely difficult to choose the best ones. It all depends on the trader’s style and what they prefer to use during their technical analysis.
The Best Oscillators and Trend Indicators for beginners
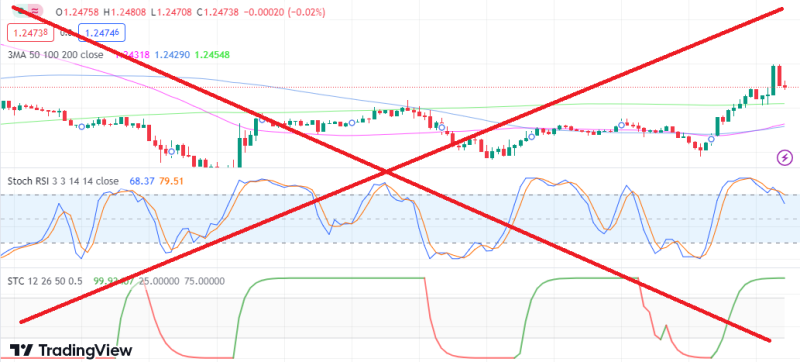
Using as few indicators on the chart as possible can be a defining factor in maintaining the balance of indicators and chart visibility. While indicators are great tools that can assist in analyzing markets, too many of them can make it impossible to see important price dynamics on the chart. Let’s explain oscillators and trend indicators and define the 3 of the most simple and powerful technical indicators every beginner trader should learn.
Oscillators are indicators that track the price and predict the potential reversal points or when the price is oversold or overbought compared to the average price. The majority of oscillators are based on calculations from various moving averages. Moving averages are trend indicators that show the average price for certain periods of time on the chart. They follow the price and give traders an insight into what the market is doing compared to average prices.
Moving Average Convergence Divergence (MACD)
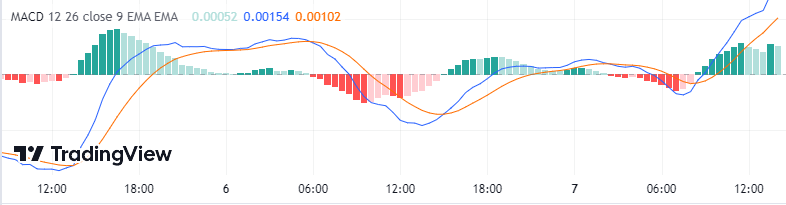
MACD is among the most beloved and popular oscillators, it is based on multiple moving averages and shows overbought and oversold levels. Traders use MACD to analyze price trends, identify potential trading opportunities, and generate buy or sell signals. It helps determine trend reversals, assess trend strength, and detect potential entry or exit points in the market.
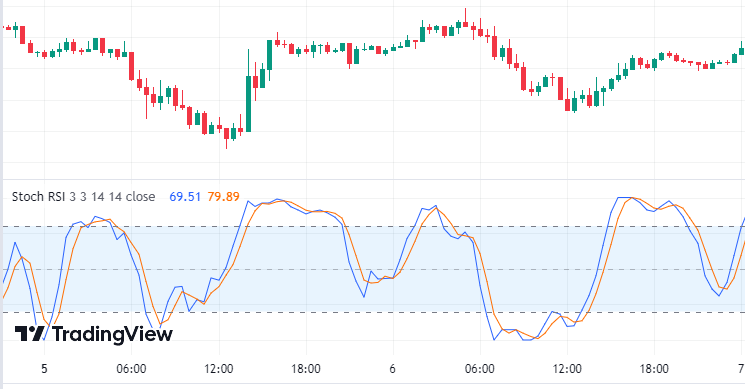
Stochastic RSI combines two indicators, stochastic and Relative Strength Index (RSI) , to calculate the oversold and overbought levels in the market. Stochastic RSI is an amazing indicator as it combines two popular indicators into one oscillator and makes it much easier to read them simultaneously and make more accurate decisions. Traders use it to find buying opportunities when it crosses above the oversold threshold and selling opportunities when it crosses below the overbought threshold.
Click Image To View Full Size
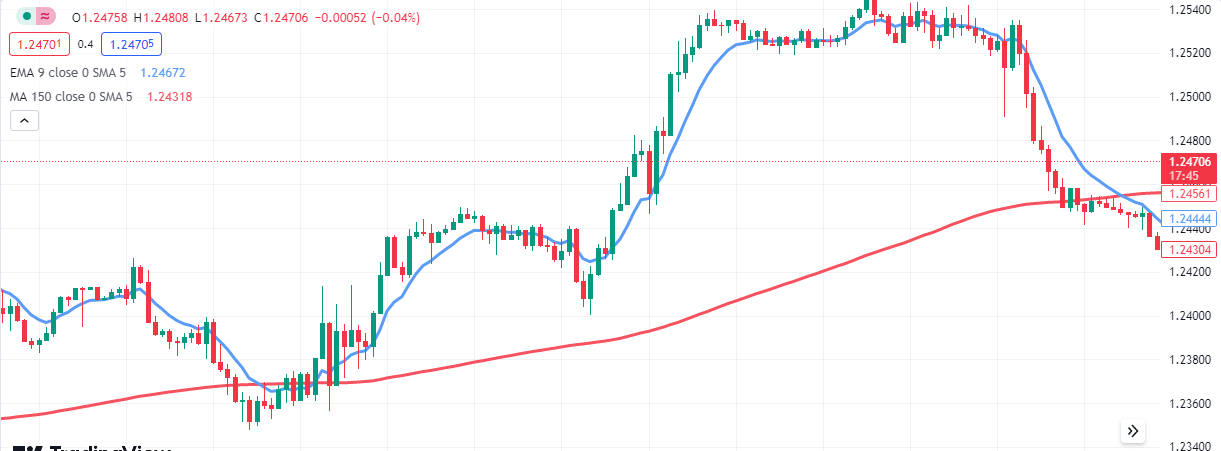
Moving averages are probably the most popular and well-known basic indicators that every trader has used at some point in their career. Moving averages follow prices and show the average prices for specified periods of time. A simple moving average (SMA) is the most basic form, where each data point is given equal weight. For example, a 20-day SMA would calculate the average closing price of the asset over the past 20 days. Moving averages crossover is a very popular trading approach for beginners but it bears its risks. Because the trends are only occurring about 30% of the time using trend indicators such as moving averages can be extremely risky for beginners. The best approach is to use 2 or 3 indicators and combine their signals for better results. With strong risk management in place and tight stop-loss controls, it should be possible to start trading as a beginner and not blow up a trading account within days.
In the end, when you are a beginner trader it is crucial not to clutter your trading charts with countless obscure indicators. This will make it frustrating and difficult to analyze charts properly and make wise decisions and predictions. Beginners often get excited about exploring many different indicators but fail to realize that profitability is not often determined by the number of indicators. Instead, beginners should aim at quality by learning and using several useful indicators that provide valuable insight without overwhelming the chart. With MACD, Stochastic RSI, and Moving averages traders will enjoy the simplicity and power of analyzing market dynamics. A balanced combination of indicators and practicing sound risk management will enable beginners to start their trading journey solidly with greater confidence and avoid unnecessary pitfalls.
Copyright (c) 2023 TheNewswire – All rights reserved.